
Porto Capanema
2,903 m³/s
measured 7:00 PM · reaches the falls around 8:00 AM
-45% there in 24 h
Station 65992502 · measured, not estimated
4,940m³/s
last 24 h4.94 million litres every second — an Olympic swimming pool every 0.5 seconds.2,500 m³ per pool · straight division, nothing rounded up
Measured · Foz do Iguaçu
Iguazu Falls is flowing at 4,940 cubic metres per second right now — 3.29 times its historical average of 1,500 m³/s. Several times the average. The river is putting on a show, and spray can hide the far bank.
The part that actually matters
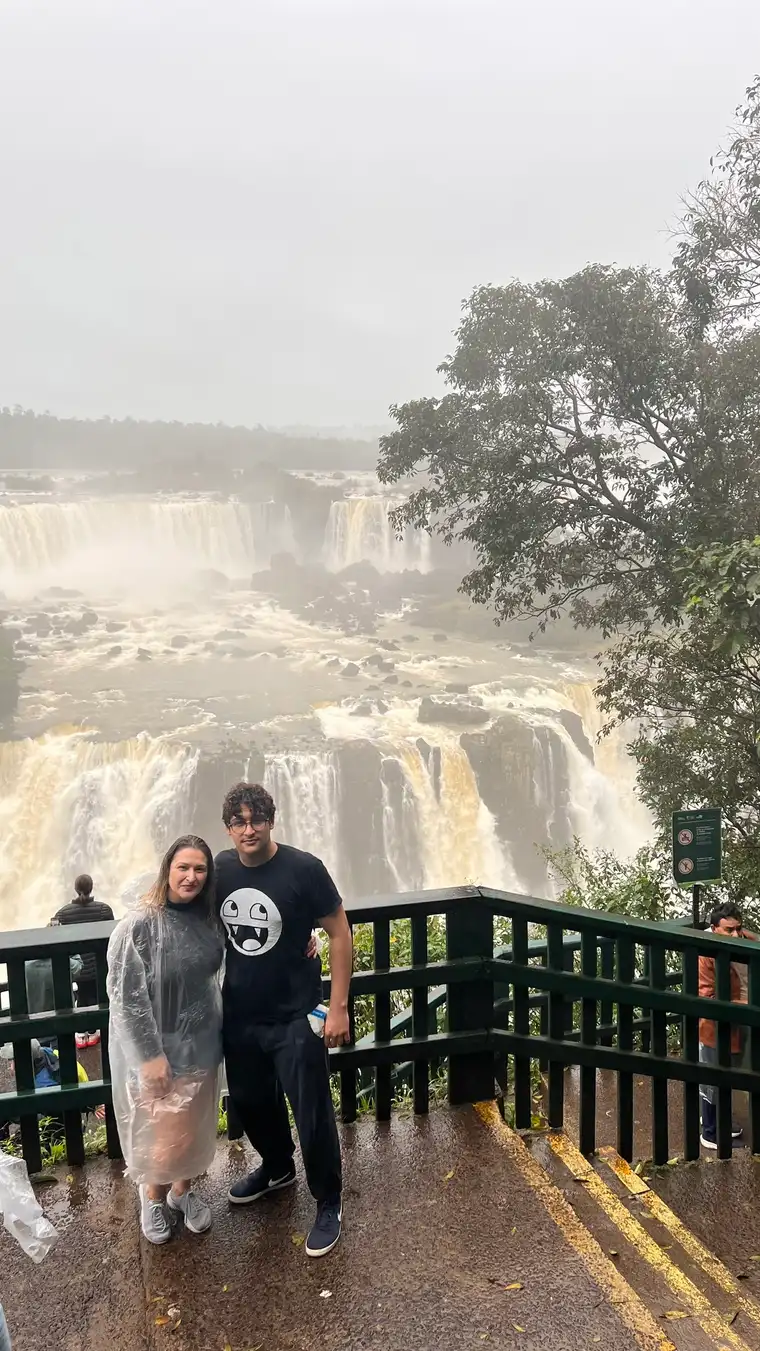
Yes, but almost never in the way people fear. Iguazu is a system of hundreds of waterfalls over a two-and-a-half kilometre cliff, and it never runs dry. What the flow changes is the character of the day: how much spray reaches the walkways, how far you can see across the gorge, and whether the falls read as many separate curtains or as one continuous wall of water.
Power over visibility
4,940 m³/s · 3.29× average · Very high flow
What each flow band changes, side by side. The lit column is where the river is right now.
| Flow band → | Lowunder 0.6× average | Below average0.6× to 0.9× | Typical0.9× to 1.5× | Strong1.5× to 2.7× | Very highabove 2.7× |
|---|---|---|---|---|---|
| Spray on the walkways | Light mist, clothes stay dry | Occasional drift near the end | Steady — a light layer helps | Heavy. You will get wet | Drenching at the closest points |
| Seeing across the gorge | Crisp all the way to the far bank | Clear, with mist only at the base | Clear, mist rising in the middle | The far bank disappears at times | Often hidden behind its own spray |
| How the falls read | Separate curtains, basalt shelves showing | Distinct falls, structure visible | The classic postcard Iguazu | Merging into broad sheets | One continuous wall of water |
| Walkways closest to the water | All open | All open | All open | Open and wet | Can close — each national park decides |
| For photographs | Sharpest detail, least mist in frame | Very good light and definition | Rainbows in the afternoon | Drama wins over detail | Power, but little definition |
The last three days, hour by hour
Over these three days the river fell 20%, between a low of 4,940 and a high of 7,271 m³/s. It turned at 1:00 PM yesterday and has been falling since.
The river tells you first
The water that will fall over Iguazu tomorrow morning is already in the river today, and it passes gauging stations on the way. Porto Capanema sees it about 13 hours before the falls do. Comparing what that station reads now against what it read 13 hours ago gives the direction of the next half day — right now that points to around 3,253 m³/s by about 8:00 AM.
The river is falling
Around 3,253 m³/s by about 8:00 AM local time — -34% from now.
Porto Capanema
2,903 m³/s
measured 7:00 PM · reaches the falls around 8:00 AM
-45% there in 24 h
Salto Caxias dam
3,816 m³/s
measured 7:00 PM · reaches the falls around 4:00 PM
-11% there in 24 h
The method is additive: today’s reading at the falls, plus the change measured upstream over the same 13-hour lag. The lag itself was measured by correlating the two stations hour by hour. This page re-runs its own predictions for the last seven days against what actually happened and publishes the score above — currently 212 hourly comparisons.
It is a trend, not an official forecast. It only works while the water is already in the river; rain that has not fallen yet is not in the number. That is why we say “around” and never publish a precise figure for a precise minute.
Give the number a scale
At 4,940 m³/s, Iguazu pours the volume of an Olympic swimming pool — 2,500 cubic metres — every 0.5 seconds. Set against the marks the river has left, that is 3.29× its historical average and 9.4× smaller than the June 2014 record, the largest flood ever measured here.
Scale note. The bars run against the June 2014 record, so an ordinary day looks small here on purpose — that contrast is the whole point. In 2014 the river carried in about 385 seconds what it now takes a full hour to move. And even down at that end of the scale, this is still the largest waterfall system on Earth by volume of water.
The mechanism
Everything that rains on 67,100 square kilometres of southern Brazil — the basin the gauging record says drains past this point — has exactly one way out, and it takes days to get here. That is why the number on this page moves so far: it is not the weather in Foz do Iguaçu, it is the weather of an entire region, arriving late.
The Iguaçu river is born near the Atlantic coast, more than a thousand kilometres away, and collects the rain of an entire state before it arrives. Rain that falls far inland today is not water you will see today — it is water that reaches the falls in the days that follow.
That delay is what makes a short-term trend possible at all
On the way down the water passes a sequence of hydroelectric dams. They absorb the small variations and can hold water back for hours, which is why the river sometimes steps up or down rather than sliding. What they cannot do is stop a flood: once the basin is saturated, the water comes through.
The river steps instead of sliding
Higher flows cluster between October and March and lower ones between July and September, but the pattern breaks often enough that a monthly average is a poor way to plan. El Niño years in particular can put a flood in a month that is supposed to be quiet.
Pack for the river you find, not for the month
Even in the driest stretch on record, water kept coming over the cliff — the system is a 2.7-kilometre escarpment with hundreds of individual drops, not a single spout that can run out.
The question is never whether there is water. Only which Iguazu is on that week
Read this the right way. October sits in the stretch the pattern calls higher, and the river is running at 3.29× its average today. That gap is the argument: the band is a tendency, not a calendar. Use it to know what to pack — never to pick the week. The live number above is the only one that describes your actual visit.
From the Brazilian side guide
The chapter that shows the falls changing with the river: volume, colour and the walkways that close when it runs high.
 FROM 9:56 · 16 MIN
From our full guide to the Brazilian side (16 min) — watch this chapter with the transcript →
Direct answers
It changes every hour. The long-term average is about 1,500 cubic metres per second, but the river regularly runs at half that in a dry spell and several times that after heavy rain in the basin. The most recent hourly reading from the gauging station at the falls is 4,940 m³/s — 3.29× the average.
Anything between roughly 1,000 and 2,200 m³/s looks like the Iguazu of the postcards. Below about 900 m³/s the rock shelves start to show; above about 4,000 m³/s the spray becomes heavy enough to hide the far bank and the lowest walkways can close.
No. Low water changes the experience rather than cancelling it: you see more of the cliff structure, the individual falls separate into distinct curtains, photographs are clearer because there is less spray, and the walkways stay open. Very high water is more dramatic but often means less visibility and more closures.
From station 65992502 — officially "Hotel Cataratas — Copel" — on the Brazilian bank at the falls, in Foz do Iguaçu, Paraná, draining 67,100 km² of basin. It is operated by Copel and its readings are published hourly through the public telemetry network of ANA, Brazil's National Water and Sanitation Agency. We read that public feed directly — nothing here is estimated.
Partly, and only for the next several hours. The same water passes gauging stations upstream before it reaches the falls: Porto Capanema about 13 hours earlier, the Salto Caxias dam about 21 hours earlier. You can see the order in their drainage areas, which only grow downstream: 57,100, 63,900 and 67,100 km². Comparing those readings gives a reliable direction for the next half day. Beyond that it depends on rain that has not fallen yet.
We re-check it against reality every hour. The page recalculates what it would have predicted for each of the last seven days and compares that to what the river actually did. Right now it has called the direction correctly 82% of the time across 212 hourly comparisons. The score is shown next to the trend, alongside what a naive "it will stay the same" guess would have scored.
It can. The walkways closest to the water — including the Devil's Throat balcony on the Argentinian side — are the first to close during major floods, and the decision belongs to each national park, not to us. Ordinary high water usually just means more spray and a poncho.
They can be, but river level alone does not tell you whether a boat operates on a given day. Operators suspend and resume on their own criteria and do not publish that status in real time. We confirm the operating status with them for your date rather than inferring it from a number.
On 9 June 2014 the river reached roughly 46,300 m³/s, about thirty times the historical average. There were smaller but still exceptional floods in October 2022 and October 2023, both of which closed walkways for days. For scale, today's reading is 9 times smaller than that record.
There is no single answer, because the basin has no reliable dry season. Higher flows are more common from October to March and lower flows from July to September, but both patterns break often. Checking the live reading a few days before you travel tells you more than any monthly average.
The station reports once an hour, and this page is rendered fresh on every visit, reading the telemetry feed at most ten minutes old. There is no cached copy of the number: what you see is the latest reading the network has published.
11 questions · answers written to stand on their own, and the live numbers in them are the same readings shown above.
Where this comes from
Hotel Cataratas — Copel — gauging station 65992502, on the Brazilian bank at the falls in Foz do Iguaçu, Paraná. It reports once an hour.
ANA public telemetry — Brazil’s national water agency publishes the station’s readings on an open feed. We query it directly, never more than ten minutes old.
This page — built fresh on every single visit, with no cached copy of the number. The reading on screen was measured at Oct 9, 2026, 7:00 PM.
Reading the river is half the planning. The other half is the day itself — which side when, how long at each viewpoint, and how the border fits in.